

To create a chart in Excel, you must first choose the data to be included in it:
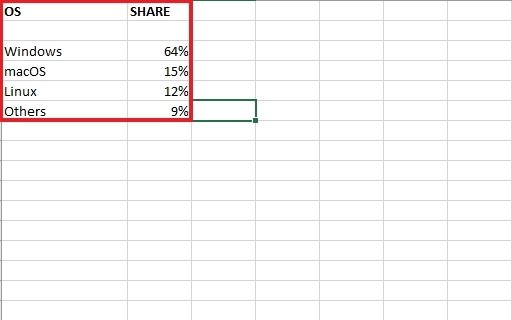 Data to create the chart
With the data selected, go to the Insert menu and click on Recommended charts:
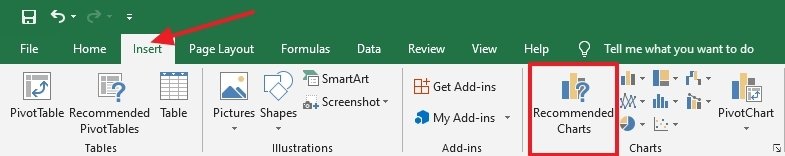 Menu and button to create the chart
An Excel window will appear showing the recommended charts. We will have to select the one we like the most and click on Accept:
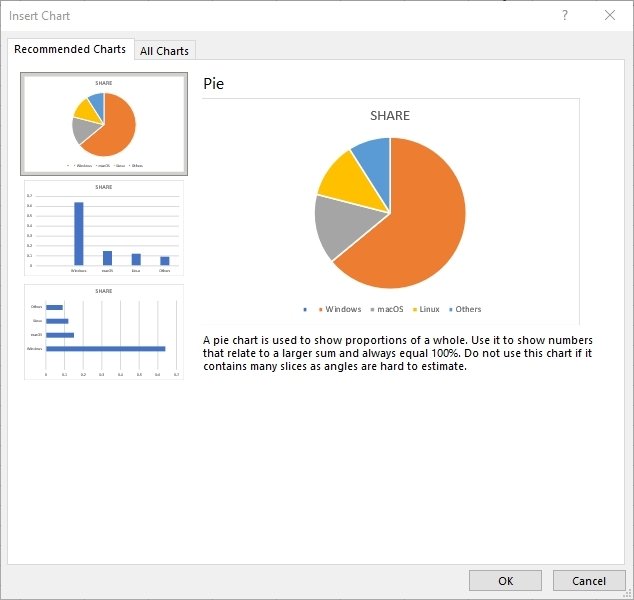 Recommended charts
The chart will be perfectly inserted into our spreadsheet:
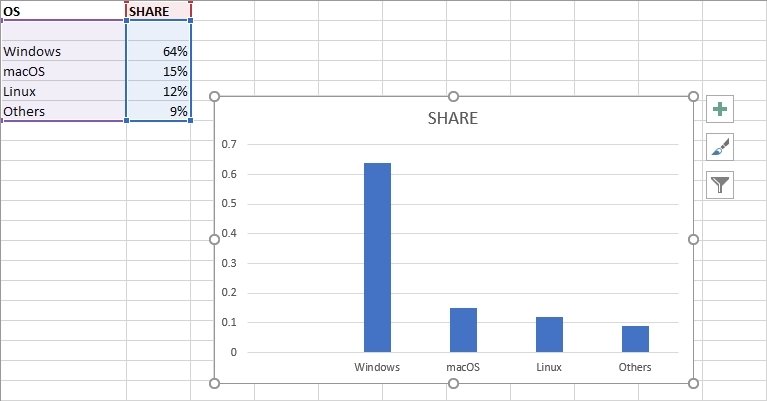 Quickly created chart inserted
Additionally, you can create a chart quickly by pressing the key combination ALT + F1 with the selected data. It will insert the chart that the software has as default, without us being able to choose which one:
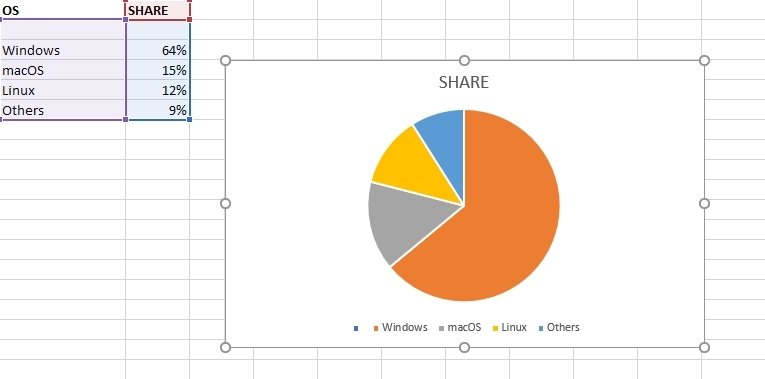 Chart selected and inserted
This is just one of the options offered by Microsoft Excel, the spreadsheet developed by Microsoft that can be found as part of the Office package, along with other programs designed for office work. Excel is used to perform financial and accounting tasks, although it can also be used for other purposes, such as organizational tasks (although there are applications more suitable for these uses).
The beginnings of Excel dates back to 1982, when Microsoft launched a spreadsheet program to get a place in a market that was just beginning at that time. This software was called Multiplan, although it would not adopt the name it is known by today until 1985, when the first version was released (exclusively for the first Apple Macintosh).
By 1985, Lotus 1-2-3 was already established as the king of spreadsheets, and Excel was its competition. In 1987, a PC version was released, and Microsoft's software began to get a foothold in the market. It is currently the standard for spreadsheet processing software.
